|
|
It is time for the Query Tuning Webinar again! This year I will be delivering the Webinar on July 24 at 10 a.m. PDT, Advanced MySQL Query Tuning, hosted by Percona. I have included some new topics about loose and tight index scan and will also show some real world examples and solutions for MySQL query optimizations.
You can register for the Webinar here. It will also be recorded, so if you can’t make it on July 24, 10am you can always watch it later.
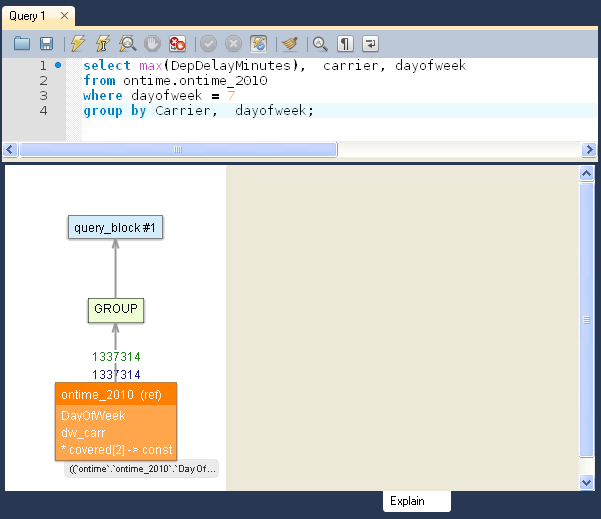
If you are tied of reading the old “text-only” output of MySQL Explain, then you will enjoy the new MySQL Visual Explain feature of MySQL Workbench (works with MySQL 5.6+).
Before:
mysql> explain select max(DepDelayMinutes),  carrier, dayofweek   from ontime.ontime_2010   where dayofweek = 7   group by Carrier,  dayofweek\G

*************************** 1. row ***************************

           id: 1

  select_type: SIMPLE

        table: ontime_2010

         type: ref

possible_keys: DayOfWeek,dw_carr,covered

          key: covered

      key_len: 2

          ref: const

         rows: 1337314

        Extra: Using where; Using index

1 row in set (0.00 sec)
After:
How to test:
- Download and Install MySQL 5.6
- Download and Install MySQL Workbench
- Enjoy
I will give 2 talks at MySQL Connect
1. New MySQL Full-Text Search Features and Solutions, where I will focus on the new (and very promising!) InnoDB full text search. I’ve done some benchmarks recently and will publish it here.
2. In-Depth Query Optimization for MySQL, where we will work on the real word examples of MySQL query tuning.
*SESSION SCHEDULE INFORMATION*
Session ID: CON9283
Session Title: New MySQL Full-Text Search Features and Solutions
Venue / Room: Hilton San Francisco – Golden Gate 8
Date and Time: 9/29/12, 14:30 – 15:30
Session ID: CON8811
Session Title: In-Depth Query Optimization for MySQL
Venue / Room: Hilton San Francisco – Golden Gate 8
Date and Time: 9/30/12, 14:45 – 15:45
Full Agenda
MySQL Enterprise 5.5 (trial version available here) includes MySQL PAM authentication plugin. In this post I will show how to configure it with the OpenLDAP and Active Directory.
MySQL PAM authentication uses Linux pam_ldap library to send the calls. To configure MySQL LDAP authentication we will need to configure pam_ldap on linux.
OpenLDAP Linux configuration
- Make sure that libpam-ldap/openldap is installed. If not, on RedHat/CentOS use commands:
# yum install openldap openldap-clients
- Configure /etc/ldap.conf. Sample configuration:
debug 10 # set debug level only during the initial configuration

base dc=corp,dc=company_name,dc=com

binddn cn=service_account,OU=Service Accounts,OU=US Security,DC=corp,DC=company_name,DC=com

bindpw <password>

timelimit 120

idle_timelimit 3600

uri ldaps://<LDAP URL>:<LDAP PORT>
# The following lines are needed only for Active Directory
pam_login_attribute samaccountname

pam_member_attribute member

nss_map_objectclass posixAccount user

nss_map_objectclass shadowAccount user

nss_map_attribute uid sAMAccountName

nss_map_attribute homeDirectory unixHomeDirectory

nss_map_attribute shadowLastChange pwdLastSet

nss_map_objectclass posixGroup group

nss_map_attribute uniqueMember member

pam_login_attribute sAMAccountName

pam_filter objectclass=User

pam_password ad
Make sure you can connect to ldap
# telnet <ldap server> <ldap password> (should show “connected”)
Make sure you can search ldap with ldapsearch
# ldapsearch –w <password for bind user> -x –D 'cn=USER,OU=People …' “(&(ObjectClass=user)(cn=USERNAME))”
MySQL configuration
To setup mysql follow the instructions from http://dev.mysql.com/doc/refman/5.5/en/pam-authentication-plugin.html
- Make sure you use MySQL 5.5.16+ enterprise version
- Add line:
plugin-load=authentication_pam.so
into my.cnf and restart mysql server
- Put the following in /etc/pam.d/mysql:
#%PAM-1.0

auth        required    pam_ldap.so

account     required    pam_ldap.so
Individual User Authentication
- Create user for group substitution
CREATE USER 'user_name'@'localhost'

IDENTIFIED WITH authentication_pam

AS 'mysql';
Where mysql = name of the /etc/pam.d/mysql file above, user_name should match the LDAP’s uid (samaccountname for AD).
- Login to mysql with your LDAP username and password
mysql --user=user_name --password=verysecret mydb
Group Authentication
- Create user for group substitution
CREATE USER ''@''

IDENTIFIED WITH authentication_pam

AS 'mysql, ldap_group1=mysql_user1, ldap_group2=mysql_user2';
Where mysql = name of the /etc/pam.d/mysql file above, ldap_group1 is the ldap group, mysql_user1 is the user to substitute (we need to create this user)
- Create user for each LDAP group
CREATE USER 'mysql_user1'@'localhost' IDENTIFIED BY 'very secret password';

GRANT ALL PRIVILEGES ON mydevdb.* TO 'mysql_user1'@'localhost';

GRANT PROXY ON 'mysql_user1'@'localhost' TO ''@'';
- Login to mysql with your LDAP username and passwordand make sure the user was substituted correctly:
mysql --user=user_name --password=verysecret mydb
mysql> SELECT USER(), CURRENT_USER(), @@proxy_user;
+-------------------+-----------------------+--------------+
| USER() | CURRENT_USER() | @@proxy_user |
+-------------------+-----------------------+--------------+
| user_name@localhost | mysql_user1@localhost | ''@'%' |
+-------------------+-----------------------+--------------+
Debugging
- Add “debug 16” (or other level, 0 to 256) into /etc/ldap.conf
- Add “export AUTHENTICATION_PAM_LOG=1” to /etc/init.d/mysql and restart mysql
- Then for troubleshoot look into mysql error log (i.e. /var/log/mysqld.log).
Current issues
Due to some PAM library’s limitations the group authentication may not work with Active Directory (individual authentication works fine), probably because the “posix_group” is not fully supported by Active Directory.
Links and more info
In my previous post, I’ve showed how to use Dtrace to find queries creating disk temporary tables (only available for OS with dtrace: solaris, freebsd, etc).
In MySQL 5.6 (which is not released yet, use “labs” version for now) we can use new performance_schema table events_statements_history or events_statements_history_long to find all performance metrics for all queries including created disk/memory tables, use of index, etc. WOW! This is what I have been waiting for a long time!
To illustrate, I have grabbed mysql-5.6.3-labs-performance-schema-linux2.6-x86_64.tar.gz from labs.mysql.com (this feature is only in labs version) and run sysbench readonly test (you need to disable prepared statements in sysbench, seems to be not working with prepared statements, I will check it later).
Here are the results:
mysql> select * from events_statements_history_long where  CREATED_TMP_DISK_TABLES > 0 limit 10\G
*************************** 10. row ***************************
              THREAD_ID: 74
               EVENT_ID: 3295633
             EVENT_NAME: statement/sql/select
                 SOURCE: sql_parse.cc:935
            TIMER_START: 633828149000000
              TIMER_END: 633843868000000
             TIMER_WAIT: 15719000000
              LOCK_TIME: 53000000
               SQL_TEXT: SELECT DISTINCT c from sbtest where id between 847399 and 847499 order by c
         CURRENT_SCHEMA: sbtest
            OBJECT_TYPE: NULL
          OBJECT_SCHEMA: NULL
            OBJECT_NAME: NULL
  OBJECT_INSTANCE_BEGIN: NULL
            MYSQL_ERRNO: 0
      RETURNED_SQLSTATE: NULL
           MESSAGE_TEXT: NULL
                 ERRORS: 0
               WARNINGS: 0
          ROWS_AFFECTED: 0
              ROWS_SENT: 1
          ROWS_EXAMINED: 103
CREATED_TMP_DISK_TABLES: 1
     CREATED_TMP_TABLES: 1
       SELECT_FULL_JOIN: 0
 SELECT_FULL_RANGE_JOIN: 0
           SELECT_RANGE: 1
     SELECT_RANGE_CHECK: 0
            SELECT_SCAN: 0
      SORT_MERGE_PASSES: 0
             SORT_RANGE: 0
              SORT_ROWS: 1
              SORT_SCAN: 1
          NO_INDEX_USED: 0
     NO_GOOD_INDEX_USED: 0
       NESTING_EVENT_ID: NULL
     NESTING_EVENT_TYPE: NULL
10 rows in set (0.00 sec)
Or if you need only list of queries:
mysql> select sql_text, count(*) as cnt  from events_statements_history_long
where  CREATED_TMP_DISK_TABLES > 0
group by sql_text order by cnt desc  limit 10;
+-----------------------------------------------------------------------------+-----+
| sql_text                                                                    | cnt |
+-----------------------------------------------------------------------------+-----+
| SELECT DISTINCT c from sbtest where id between 242012 and 242112 order by c |   2 |
| SELECT DISTINCT c from sbtest where id between 797388 and 797488 order by c |   2 |
| SELECT DISTINCT c from sbtest where id between 973150 and 973250 order by c |   1 |
| SELECT DISTINCT c from sbtest where id between 478783 and 478883 order by c |   1 |
| SELECT DISTINCT c from sbtest where id between 967035 and 967135 order by c |   1 |
| SELECT DISTINCT c from sbtest where id between 602102 and 602202 order by c |   1 |
| SELECT DISTINCT c from sbtest where id between 123827 and 123927 order by c |   1 |
| SELECT DISTINCT c from sbtest where id between 980527 and 980627 order by c |   1 |
| SELECT DISTINCT c from sbtest where id between 450354 and 450454 order by c |   1 |
| SELECT DISTINCT c from sbtest where id between 674804 and 674904 order by c |   1 |
+-----------------------------------------------------------------------------+-----+
10 rows in set (0.04 sec)
We can filter and order by rows_examined, SORT_MERGE_PASSES, NO_INDEX_USED, NO_GOOD_INDEX_USED, etc.
Links:
With the standard data warehousing queries we have a fact table and dimension tables and we join them.
For example, the fact table (Table size: 5M rows, ~2G in size) from my previous Loose index scan vs. covered indexes in MySQL post:
    CREATE TABLE `ontime_2010` (
      `YearD` int(11) DEFAULT NULL,
      `MonthD` tinyint(4) DEFAULT NULL,
      `DayofMonth` tinyint(4) DEFAULT NULL,
      `DayOfWeek` tinyint(4) DEFAULT NULL,
      `Carrier` char(2) DEFAULT NULL,
      `Origin` char(5) DEFAULT NULL,
      `DepDelayMinutes` int(11) DEFAULT NULL,
      `AirlineID` int(11) DEFAULT NULL,
      `Cancelled` tinyint(4) DEFAULT NULL,
    ... more fields here ...
    ) ENGINE=InnoDB DEFAULT CHARSET=latin1
(this is not the best possible fact table as the data is not aggregated by I’ll use it for now).
And we have those dimensions tables:
 CREATE TABLE `airlines` (
  `AirlineID` int(11) NOT NULL DEFAULT '0',
  `AirlineName` varchar(255) DEFAULT NULL,
  PRIMARY KEY (`AirlineID`),
  KEY `AirlineName` (`AirlineName`)
) ENGINE=InnoDB DEFAULT CHARSET=latin1

CREATE TABLE `date_dayofweek` (
  `code` int(11) NOT NULL DEFAULT '0',
  `description` varchar(255) DEFAULT NULL,
  PRIMARY KEY (`code`),
  KEY `description` (`description`)
) ENGINE=InnoDB DEFAULT CHARSET=latin1
1 row in set (0.00 sec)

mysql> select * from date_dayofweek order by code;
+------+-------------+
| code | description |
+------+-------------+
|    1 | Monday      |
|    2 | Tuesday     |
|    3 | Wednesday   |
|    4 | Thursday    |
|    5 | Friday      |
|    6 | Saturday    |
|    7 | Sunday      |
|    9 | Unknown     |
+------+-------------+
8 rows in set (0.00 sec)
So here is the example query (find sum of cancelled flights on Sundays for the given airline group by day):
select sum(Cancelled), FlightDate, AirlineName
from ontime_2010 o, date_dayofweek dow, airlines a
where o.dayofweek=dow.code and dow.description = 'Sunday'
and a.AirlineID = o.AirlineID and a.AirlineName = 'Delta Air Lines Inc.: DL'
group by FlightDate order by FlightDate desc limit 10\G
To fix the query we can add a covered index for ontime_2010, so that all fields for ontime_2010 table will be covered:
alter table ontime_2010 add key cov2(AirlineID, dayofweek, FlightDate, Cancelled);
However we will still have “temporary table and filesort”:
mysql> explain select sum(Cancelled), FlightDate
from ontime_2010 o, date_dayofweek dow, airlines a
where o.dayofweek=dow.code and dow.description = 'Sunday'
and a.AirlineID = o.AirlineID and a.AirlineName = 'Delta Air Lines Inc.: DL'
group by FlightDate order by FlightDate desc limit 10\G
*************************** 1. row ***************************
           id: 1
  select_type: SIMPLE
        table: dow
         type: ref
possible_keys: PRIMARY,description
          key: description
      key_len: 258
          ref: const
         rows: 1
        Extra: Using where; Using index; Using temporary; Using filesort
*************************** 2. row ***************************
           id: 1
  select_type: SIMPLE
        table: a
         type: ref
possible_keys: PRIMARY,AirlineName
          key: AirlineName
      key_len: 258
          ref: const
         rows: 1
        Extra: Using where; Using index
*************************** 3. row ***************************
           id: 1
  select_type: SIMPLE
        table: o
         type: ref
possible_keys: DayOfWeek,covered,AirlineID,cov2
          key: cov2
      key_len: 7
          ref: ontime.a.AirlineID,ontime.dow.code
         rows: 24417
        Extra: Using where; Using index
3 rows in set (0.00 sec)
To avoid filesort we can re-write this query with "subqueries":
mysql> explain select sum(Cancelled), FlightDate  from ontime_2010 o
where o.dayofweek= (select code from date_dayofweek where description = 'Sunday')
and AirlineID = (select AirlineID from airlines where AirlineName = 'Delta Air Lines Inc.: DL')
group by FlightDate limit 10\G
*************************** 1. row ***************************
           id: 1
  select_type: PRIMARY
        table: o
         type: ref
possible_keys: DayOfWeek,covered,AirlineID,cov2
          key: cov2
      key_len: 7
          ref: const,const
         rows: 152510
        Extra: Using where; Using index
*************************** 2. row ***************************
           id: 3
  select_type: SUBQUERY
        table: airlines
         type: ref
possible_keys: AirlineName
          key: AirlineName
      key_len: 258
          ref:
         rows: 1
        Extra: Using where; Using index
*************************** 3. row ***************************
           id: 2
  select_type: SUBQUERY
        table: date_dayofweek
         type: ref
possible_keys: description
          key: description
      key_len: 258
          ref:
         rows: 1
        Extra: Using where; Using index
3 rows in set (0.00 sec)
As MySQL will use indexes when we have "field = (select .. )" and now all fields in the index belong to the single table, MySQL will use index and avoid filesort. Please note: this will not work with "field in (select ...)" and also make sure that the subselect part will return only 1 row.
Lets say we have a table storing mail messages and we need to show user’s mailbox: messages sent “from” and “to” the specified user.
Here is our table:
CREATE TABLE `internalmail` (
  `mail_id` int(10) NOT NULL AUTO_INCREMENT,
  `senderaddress_id` int(10) NOT NULL,
  `recipientaddress_id` int(10) NOT NULL,
  `mail_timestamp` timestamp NULL DEFAULT NULL,
... message body, etc ...
  PRIMARY KEY (`mail_id`),
) ENGINE=InnoDB DEFAULT CHARSET=latin1
And our query:
select * from internalmail
 where (senderaddress_id = 247 or recipientaddress_id = 247 or recipientaddress_id = 0)
and mail_timestamp > '2010-08-01 12:30:47'
order by mail_timestamp desc
In this query we show all messages from and to user_id = 247 plus all messages to system user (user_id=0). We need to show only messages for the last 3 months and show the most recent messages first.
To speed up the query we can try creating indexes:
KEY `recipientaddress_id` (`recipientaddress_id`),
KEY `senderaddress_id` (`senderaddress_id`),
KEY `mail_timestamp` (`mail_timestamp`),
However, as the query uses “OR”, MySQL will use a filesort.
mysql> explain select * from internalmail
where (senderaddress_id = 247 or recipientaddress_id = 247 or recipientaddress_id = 0)
and mail_timestamp > '2010-08-01 12:30:47'
order by mail_timestamp desc\G
*************************** 1. row ***************************
           id: 1
  select_type: SIMPLE
        table: internalmail
         type: ALL
possible_keys: recipientaddress_id,senderaddress_id,mail_timestamp
          key: NULL
      key_len: NULL
          ref: NULL
         rows: 4843257
        Extra: Using where; Using filesort
1 row in set (0.00 sec)
UPDATE: even if we will create combined indexes on (recipientaddress_id,mail_timestamp) and/or (senderaddress_id,mail_timestamp) those indexes will not be used, as the query contains “OR” in the where clause.
And original query runs for 3 seconds. To fix this query we can do 2 things:
- Rewrite query with UNION instead of OR
- Create combined indexes
First, we rewrite query with UNION:
(select * from internalmail where senderaddress_id = 247 and mail_timestamp > ‘2010-08-19 12:30:47’)
union
(select * from internalmail where recipientaddress_id = 247 and mail_timestamp > ‘2010-08-19 12:30:47’)
union
(select * from internalmail where recipientaddress_id = 0 and mail_timestamp > ‘2010-08-19 12:30:47’)
order by mail_timestamp desc;
Second, we create 2 indexes:
mysql> alter table internalmail add key send_dt(senderaddress_id, mail_timestamp);
mysql> alter table internalmail add key recieve_dt(recipientaddress_id, mail_timestamp);
After that, MySQL will be able to fully utilize index for each of the 3 queries in union:
mysql> explain
(select * from internalmail where senderaddress_id = 247  and mail_timestamp > '2010-08-19 12:30:47')
union
(select * from internalmail where  recipientaddress_id = 247  and mail_timestamp > '2010-08-19 12:30:47')
union
(select * from internalmail where  recipientaddress_id = 0  and mail_timestamp > '2010-08-19 12:30:47')
order by mail_timestamp desc\G
*************************** 1. row ***************************
           id: 1
  select_type: PRIMARY
        table: internalmail
         type: range
possible_keys: senderaddress_id,mail_timestamp,send_dt
          key: send_dt
      key_len: 9
          ref: NULL
         rows: 5
        Extra: Using where
*************************** 2. row ***************************
           id: 2
  select_type: UNION
        table: internalmail
         type: range
possible_keys: recipientaddress_id,mail_timestamp,recieve_dt
          key: recieve_dt
      key_len: 9
          ref: NULL
         rows: 11
        Extra: Using where
*************************** 3. row ***************************
           id: 3
  select_type: UNION
        table: internalmail
         type: range
possible_keys: recipientaddress_id,mail_timestamp,recieve_dt
          key: recieve_dt
      key_len: 9
          ref: NULL
         rows: 1
        Extra: Using where
*************************** 4. row ***************************
           id: NULL
  select_type: UNION RESULT
        table:
         type: ALL
possible_keys: NULL
          key: NULL
      key_len: NULL
          ref: NULL
         rows: NULL
        Extra: Using filesort
4 rows in set (0.00 sec)
Although this query has to perform a final filesort it is much faster: now it runs in 0 sec compared to 3 seconds originally.
Loose index scan in MySQL can really help optimizing “group by” queries in some cases (for example, if you have only min() and/or max() as your aggregate functions). For example, if you have this query (to find maximum delay for all US flights with departure on Sundays in 2010):
select max(DepDelayMinutes), 	carrier, dayofweek
from ontime_2010
where dayofweek = 7
group by Carrier,  dayofweek
the usual case will be adding a covered index on (dayofweek, Carrier, DepDelayMinutes). And MySQL will use this index fine (using index mean it will use the covered index):
mysql> explain select max(DepDelayMinutes), Carrier, dayofweek from ontime_2010
where dayofweek =7 group by Carrier, dayofweek\G
*************************** 1. row ***************************
           id: 1
  select_type: SIMPLE
        table: ontime_2010
         type: ref
possible_keys: covered
          key: covered
      key_len: 2
          ref: const
         rows: 905138
        Extra: Using where; Using index
1 row in set (0.00 sec)
However, as the dayofweek part has low number of unique values, mysql will have to scan a lots of index entries (estimated rows: 905138).
Continue reading Loose index scan vs. covered indexes in MySQL
First of all: mysqldump is not converting tables. It is something else. Here is the story:
One of my clients had a case when they were migrating to a new mysql server: they used mysqldump to export data from the old server (all InnoDB) and imported it to the new server. When finished, all the tables became MyISAM on the new server. So they asked me this question:
“Why mysqldump is converting my tables from InnoDB to MyISAM?”
Continue reading Why mysqldump is converting my tables from InnoDB to MyISAM?
I’ll be speaking on MySQL Users Conference 2010. Talk: MySQL Architecture Design Patterns for Performance, Scalability, and Availability, 11:55am Thursday, 04/15/2010. Details.
|
|